How We Build Global Hazard Forecasts
Disaster risk = hazard x exposure x vulnerability
Disaster risk can be described as the product of three forces: hazard, exposure, and vulnerability.
- Hazard is increasing as climate change warms the atmosphere and ocean. The clearest links are heavier precipitation, including stronger atmospheric river impacts in some regions, and sea-level rise driven by ocean warming and melting land ice, which is making coastal flooding more frequent and severe.
- Exposure is increasing as more people and more infrastructure are concentrated in dense coastal communities.
- Vulnerability has both a human and an economic component: it shapes how many lives are at risk and how severe the losses can be when a disaster strikes. Human vulnerability is often greatest in under-resourced communities and lower-income countries, and it can deepen where population growth and development outpace warning systems, infrastructure, and emergency capacity.
For human vulnerability, the number one way to reduce loss of life is better forecasting and dissemination. When hazard information is accessible, interpretable, and actionable, people can better prepare, move, and respond before impact.
That is where our public global hazard layer fits. We turn weather and ocean guidance into a global hazard layer by aligning wind, waves, precipitation, temperature, and pressure to a common forecast timeline, translating them into shared severity, and flagging where upstream gaps degrade the result. It is not a full impact model. It gives a shared view of where conditions are worsening and sets up the harder question our coastal tools are built to answer: what those conditions are likely to do at the shoreline.
From model fields to hazard guidance
Forecast models provide global wind, wave height, pressure, precipitation, temperature, and moisture fields on different grids, in different units, with different failure modes, and with different land-water behavior. Offshore wind does not automatically result in coastal flooding. Winter weather depends on precipitation type, not temperature alone. Heavy rainfall can matter inland while saying little about open water.
To turn that into usable hazard guidance, four things have to happen every cycle:
- align unlike inputs to the same forecast cycle and valid time
- translate unlike variables into a shared severity framework
- respect whether a hazard belongs over land, water, or the coastal boundary between them
- expose degraded or missing upstream inputs instead of hiding them
If any of those steps breaks, the output can overstate what the forecast supports.
How we derive the hazard field
We first align atmospheric and ocean guidance to a common forecast timeline, then derive six base-grid hazard families plus a companion severe convective layer. We recompute that hazard field for each of the four daily GFS cycles (00Z, 06Z, 12Z, and 18Z), out to day 16 on a hybrid cadence: hourly through day 1, 3-hourly through day 4, and 6-hourly thereafter.
| Layer | Elevated | Significant | Severe | Scope / notes |
|---|---|---|---|---|
| Wind | 34 kt or higher | 48 kt or higher | 64 kt or higher | Global |
| Waves | 3 m significant wave height or higher | 5 m or higher | 8 m or higher | Water-only |
| Precipitation | 10 mm/hr or higher | 25 mm/hr or higher | 50 mm/hr or higher | Land-only |
| Winter | Snow, freezing rain, or ice pellets with at least 2 mm/hr precipitation | Freezing rain or ice pellets with at least 5 mm/hr precipitation | Freezing rain with at least 10 mm/hr precipitation | Land-only; requires precipitation type |
| Temperature stress | Apparent temperature 95°F or hotter, -10°F or colder | Apparent temperature 103°F or hotter, -20°F or colder | Apparent temperature 110°F or hotter, -30°F or colder | Land-only |
| Coastal | Near-shore wind or waves reaches Elevated | Near-shore wind or waves reaches Significant | Severe base, or Significant wind and waves together, with optional pressure context | Near-coast compound layer; published only when both wind and waves are available for that lead |
| Convective | Derived | Derived | Derived | Combined from derived convective wind and hail risk |
The base grid carries six standard families: wind, waves, precipitation, winter, temperature stress, and coastal. Severe convective risk is part of the product too, but we publish it as a companion section rather than as a seventh base-grid family. We derive the convective levels in two steps: first we require modeled storm support from signals such as reflectivity and convective precipitation, then we assign wind and hail severity from increasingly strict combinations of instability, shear, lapse rates, gust support, and freezing-level context for hail. The combined convective layer view takes the stronger of the wind and hail signals.
The compound coastal layer starts from the stronger of near-shore wind or waves when both inputs are available for that lead, steps up when both are at least Significant, and can strengthen further when the surrounding pressure pattern points to a more consequential setup. That is why pressure appears here as context for coastal severity rather than as a separate public hazard layer. More broadly, aggregation matters as much as thresholds: we would rather preserve a local maximum and the first meaningful threshold crossing than smooth the field into something cleaner-looking but less operationally honest.
Interpreting the output
A useful hazard forecast should answer four questions quickly: where is the hazard, how severe is it, what is driving it, and how much confidence does the signal deserve? We group severity into Elevated, Significant, and Severe. Here, confidence is not a separate probability score: the first cue is whether a view at that lead is fully computed or explicitly marked degraded because required upstream inputs were partial or missing.
We show the forecast in two complementary ways:
- The continuous field shows the spatial structure of severity across the globe.
- The companion event layer groups the clearest higher-severity areas into identifiable situations that can be followed through time.
The event layer is designed to favor coherent features, suppress clutter, and link related areas across forecast steps so users can follow an event. For coastal events, summaries can also carry the peak drivers, including pressure when it materially reinforces the signal.
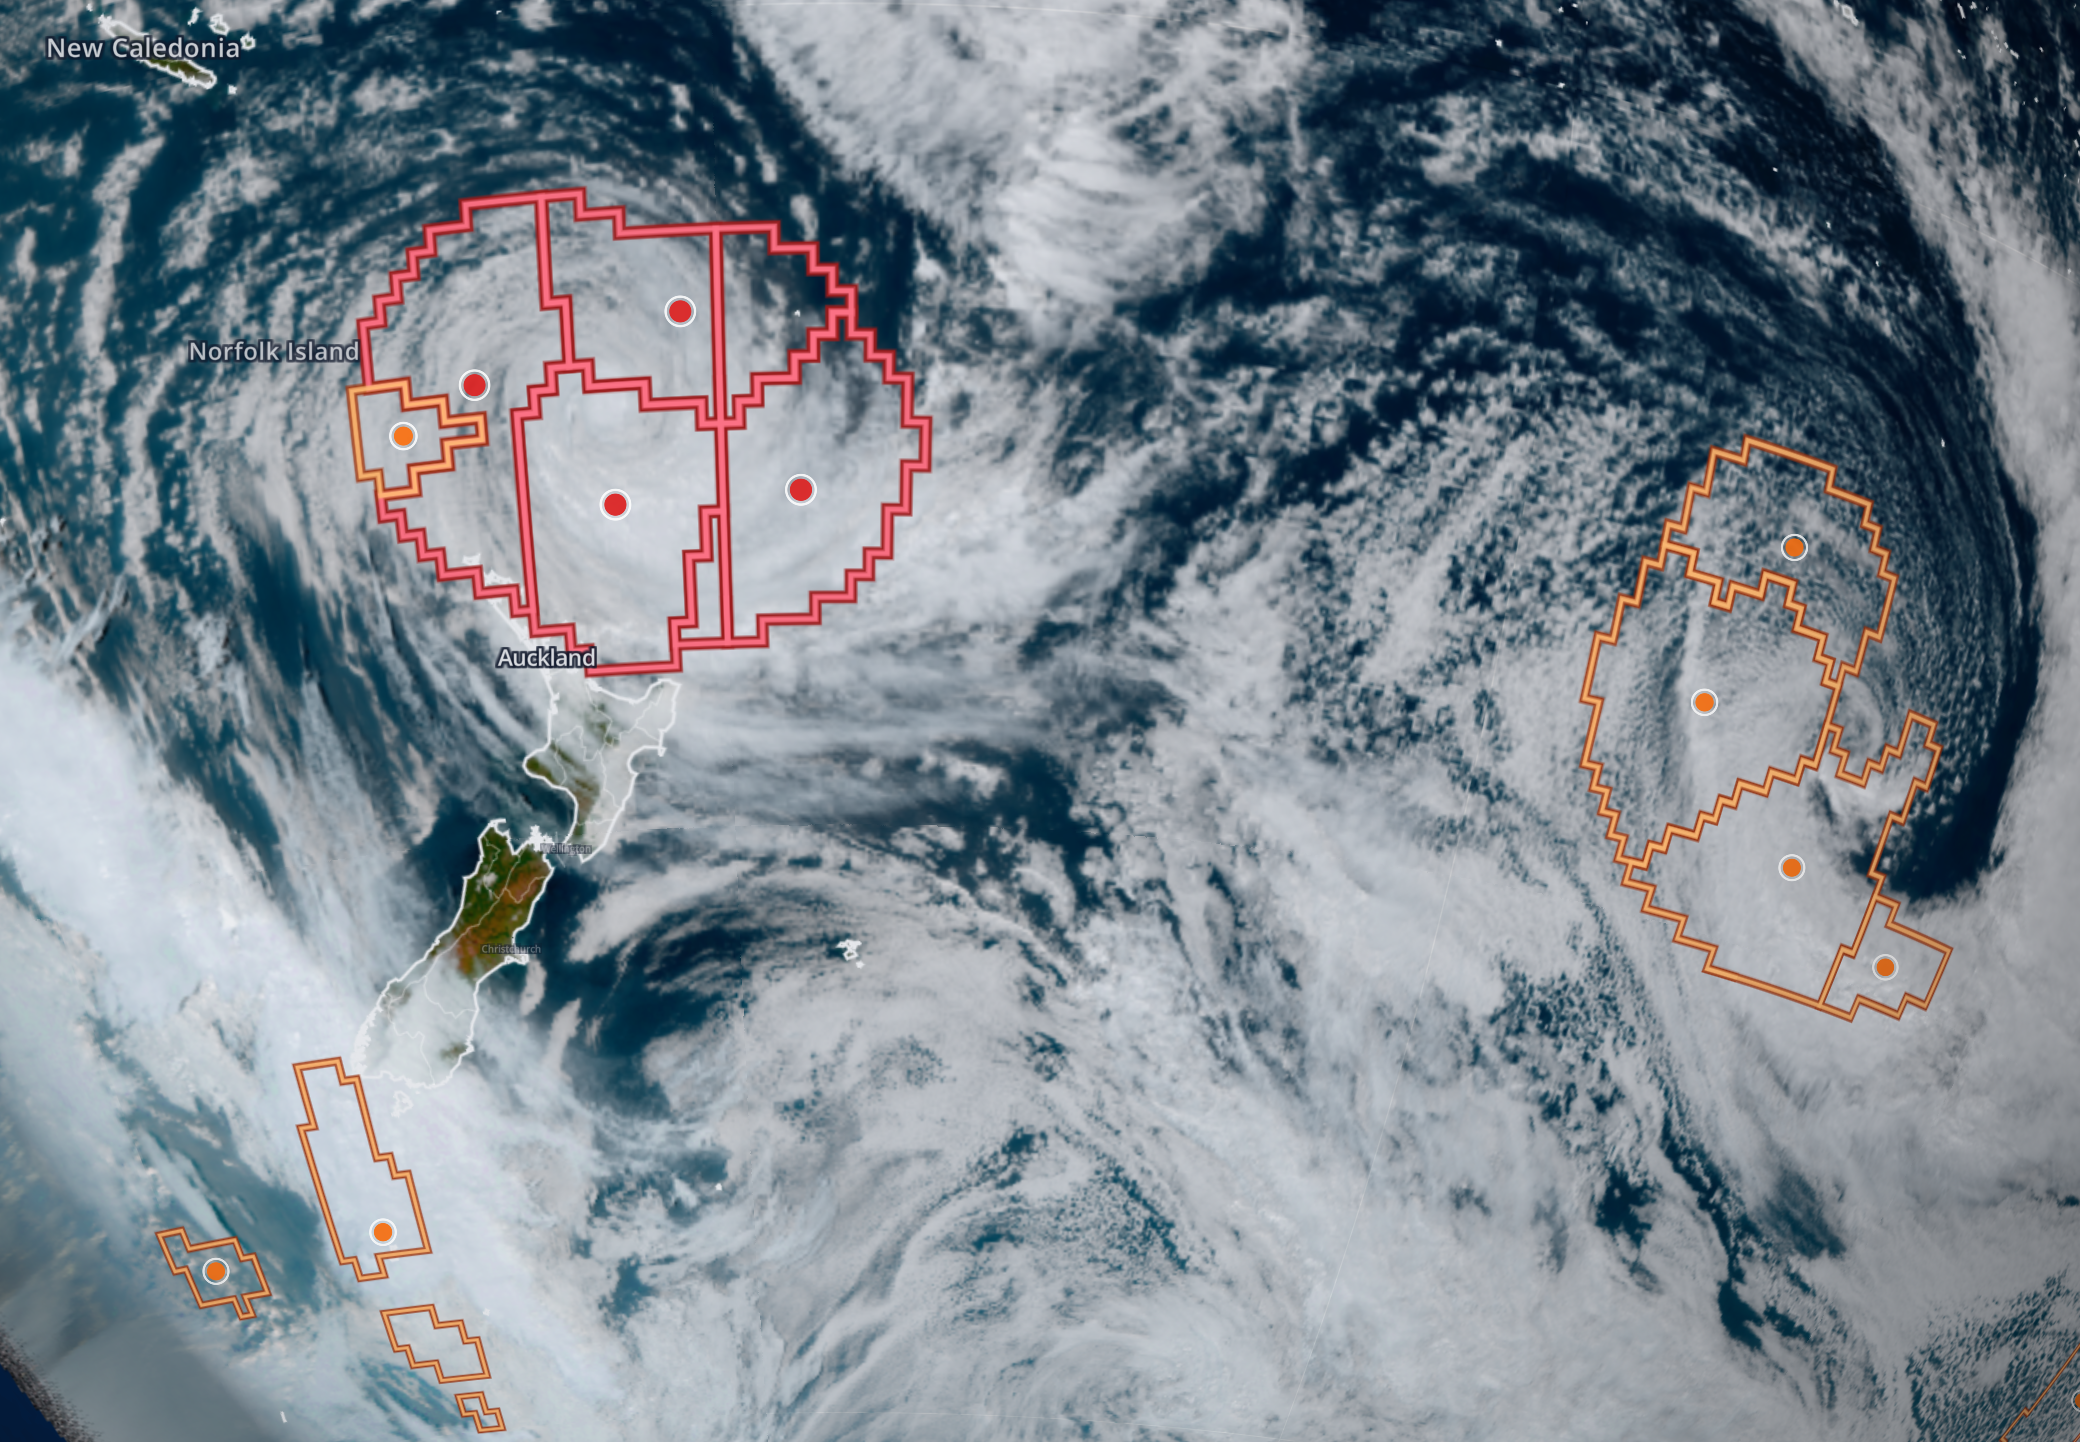
In Figure 1, Tropical Cyclone Vaianu is shown crossing the northern tip of New Zealand on April 10, 2026. Aligned wind and wave guidance raise the compound coastal layer, pressure can help explain why the event peaks where it does, and the tracker turns that peak into one followable event.
The view below shows that separation in motion: the hazard field provides the spatial backdrop, while tracked events provide the shorter operational read on the most consequential signal.
What comes next
We publish the global hazard layer because hazard is the first ingredient in disaster risk and the part we can map globally with a consistent public method. It gives researchers, operators, and forecasters a shared view of where conditions are deteriorating and makes that information easier to access, interpret, and act on.
However, hazard is only one part of the equation. Near shore, the harder problem is the full risk picture: how shoreline impact, exposure, vulnerability, local geometry, and compound drivers combine, and with what probability. Coastal flooding, wave attack, surge, heavy rainfall, river discharge, and drainage failure do not act independently; their interaction often determines where disruption starts and how fast it escalates.
That is core to our current work: building higher-resolution, probabilistic coastal tools to better model and assess risk at the shoreline, where impacts are most likely, and how confident we should be in that assessment.